相关热词搜索:
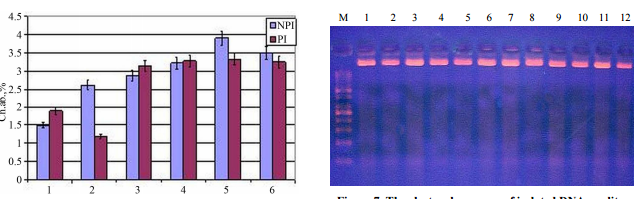
ABSTRACT The differences in satellite DNAmethylation pattern of corn seedlings with various spontaneous chromosomeaberration yields and changes in methylation pattern of these DNA sequencesunder different exposure modes of acute UV-C and chronic gamma-irradiationshave been investigated. The obtained experimental data and the conductedcorrelation analysis demonstrated the significant correlation between thesatellite DNA methylation pattern varieties and chromosome aberration yieldsunder various stress exposure modes. The role of satellite DNA methylationpattern variability and its changing in key responses to stress such as mobileelements’ activation, cell’s passage of checkpoints, and homological repair wasdiscussed. Keywords: Stress Response; Plant Resistance; Satellite DNAMethylation Pattern; Brave-Pirson Linear Correlation 1. Introduction Changingorganism’s resistance to stress factors, various reactions, which role in thisprocess depends on factor’s acting rate, duration and/or periodicity.Complexity of interactions in stress reactions can also be attributed tohierarchical-structural and functional, organism organization, where differentprocesses have various sensitivities and times of development. DNA methylationis one of the most important and polyfunctional mechanisms of biologicalregulation, which has a great significance in such epigenetic processes asgenomic imprinting, differentiation, apoptosis and morphogenesis, aging of anorganism, regulation of mobile elements’ activity [1-3]. It is also known thatmethylation of cytosine is the natural factor of mutagenesis [2] and at the sametime it is a factor affecting regional DNA structure’s organization that isnecessary for successful passage of enzymatic reactions, related to reading-outof information and reparation. Plants contain most of methylated cytosine (upto 30%); the DNA methylation of these organisms is the result of functioningfour groups of methyltransferases [2] that provide a great methylation sites’variety. It may be claimed that various methylation pathways can play importantroles in stress response reactions and rearrangements of their resistance,whereas in alternative “to run or to fight” these organisms choose “fighting”at all levels of organization. A number of last investigations show somechanges in level and pattern of DNA methylation under biotic [3,4] and differentforms of abiotic stress—dryness [3], salinization [3-6], radiation exposureswith various dose rates [7-9] and duration [8,10]. Polyfunctional of DNAmethylation process also allows different ways of its participation both infailure (e.g. activization of mobile elements, initialization of genomeinstability) and/or formation of active protective reactions, associated withmetabolism reorganization. Thus changes in DNA methylation level and/or patternunder different stress exposure [3-10] still require specification of theirbiological significance. The appearance of DNA micro array technology made arevolution in studying changes in gene expression under stress exposures.Obtained data have confirmed the connection between changes in methylation patternof transcribed DNA with changes in expression of major gene groups, metabolismrearrangements and resistance changes under stress exposure [11-13]. Copyright© 2013 SciRes. CellBio 164 D. A. SOKOLOVA ET AL. In parallel with studying themajority of changes in transcribed DNA methylation pattern in theirresponsiveness under stress exposures, great changes in satellite DNAmethylation pattern have been detected [14]. It is known that satellite DNA istrue to type component of eukaryotic genome. It consists of tandem organizedrepeats, and it is never transcribed or encoded proteins and is located inheterochromatin part of chromosome [15]. A high methylation level of satelliteDNA’ cytosine has been shown but satellite DNA’s biological importance stillhasn’t been understood. A question about biological role of changes in DNAmethylation pattern under stress exposures and subsequent changes of cellresistance is also unexplored now. The paper is dedicated to investigate theconnection between variability of satellite DNA methylation pattern andspontaneous chromosome aberration’ rate as well as changes in methylationpattern of satellite DNA under different modes of acute UV-C and chronicgamma-exposure of seedlings. The study of DNA methylation pattern is performedby comparing the chromosomal aberrations yielded in meristematic tissues as theindependent index that allowed to estimate the plant cell resistance. 2.Material and Method The investigation of connection between satellite DNAmethylation statuses with plant cell resistance to stress exposure was carriedout in three series of experiments: 1) Acute UV-C exposure of epigeneticallydifferent corn seedlings (EDS). Preliminary three groups of corn’ seedlingswith different germination rates were empiric selected: fast germinating (F-G),middle germinating (MG), and slowly germinating (S-G). A great connectionbetween germination rates and differences in transcribed DNA methylationpattern has been preinstalled; 2) Acute UV-C exposure in the mode of “adaptiveexposure-challenge exposure” with different ranges between the adaptive UV-Cirradiation and challenge one (different mode UV-C exposure). The adaptive dosewas 1 kJ/m2 and the challenge one—6.2 kJ/m2 ; Combined exposure: preliminarychronic gamma-exposure of dry seeds with various accumulative dose andsubsequent seedlings acute UV-C exposure. Two intervals between the adaptiveUV-C irradiation and challenge one were investigated: 4 hours and 24 hours. Thenecessity to expose seedlings in challenge dose (6.2 kJ/m2 ) and whole dose(7.2 kJ/m2 ) in the same physiological state was taken into account. Thus suchvariants of irradiation were used: 1) Non UV-C irradiated seedlings; 2)Adaptive exposure (1 kJ/m2 ); 3) Adaptive exposure, in 4 hours-challenging one(6.2 kJ/m2 ); 4) Whole dose exposure (7.2 kJ/m2 ); exposure simultaneously withthe challenging irradiation of variant 3; 5) Adaptive exposure, in 24hours—challenging one (6.2 kJ/m2 ); 6) Whole dose exposure (7.2 kJ/m2 );irradiation simultaneously with the challenging irradiation of variant 5. Suchways of irradiation were conducted both with seedlings from non preliminarygamma-irradiated seeds (NPI) and with seedlings from preliminarygamma-irradiated seeds (PI). The study was performed using 3 - 7-days maizeseedlings, sort Titan. Seeds’ sprouting was conducted on bottom plates with wetfilter paper, in thermostat under the temperature +23˚C - +24˚C. Bactericidalirradiator of the open type OBN-150М (Ukraine) with Philips Special TUV 30 W lampswas used. Three-day seedlings were exposed by UV-C in whole doses of 7.2 kJ/m2(dose rate was 6.2 W/m2 ) in the range 4 hours and 24 hours between adaptiveand challenging irradiation as described above. A glass container with 137CsCl2was used for investigation of chronic exposure effects; dry seeds were exposedwith dose rate 30 mR/h, accumulated dose reached 3.5 Gy. The apical rootmeristems were used as an object for cytogenetic analysis. Sampling was carriedout on the 4th day after irradiation. Detached apexes have been put to theBrodsky’ fixative (acetic acid: ethanol: formalin = 0.3:1:3) for two hours withfollowing washing by 70% ethanol (3 - 4 times). Maceration has been performedby alkaline hydrolysis with 20% NaOH over two hours. Then preparations havebeen washed in distilled water for 15 minutes. Staining was carried out byacetoarsein and hydrochloric acid mixture (acetoarsein: 1M HCl = 1:1) over 16 -18 hours. Stained samples have been washed in 45% CH3COOH with followingpreparation the crushed specimens. Ten alternative apexes were used and 5 - 10thousands of cells were analyzed for every variant. The unstable chromosomalaberrations were detected using anaphase-telophase technique due to planttissue specificity. In spite of this cells’ sampling has averaged over 300 -350 chromosomal aberrations during the anaphase in each preparation. Acytogenetic analysis was conducted on the light microscope “Jenaval” (Germany).Independent cytogenetic analisis was performed 8 times. Significance level (α)of assessment is 0.05. Isolation of DNA was performed from the 6-day-old cornseedlings with the set of reagents DiatomTM DNA Prep100 based onNucleoS-sorbent. The standard protocol for DNA extraction provided by themanufacturer was used. The concentration of DNA solution was measured byBioPhotometer Plus Eppendorf v.1.35 using standard technique [16,17]. The PCRwas carried out in the four-channel DNACopyright © 2013 SciRes. CellBio D. A.SOKOLOVA ET AL. 165 amplifier “Tercik” (“DNA-Technology”, Moscow). One primerhas been used: inter simple sequence repeatISSR (15-soro,sequence-5’-АС-АС-АС-АС-АС-АС-АС- АС--3’), were synthesized by company“Metabion” (Germany) [18]. The restriction analysis as well as the PCR wascarried out in the four-channel DNA-amplifier “Tercik” (“DNATechnology”,Moscow). Two types of restriction enzymes-isoschizomers were used: HpaII (5’.CCGG.3’), MspI (5’.C CGG.3’) and restrictase MboI (“Fermentas”, Germany).Reactions were performed according to the conventional manual by the supplier(Table 1). The reaction mixture for the HpaII-analysis (total volume 25 μl)contained: 0.2 μl HpaII, 2.0 μl 10хBuffer Tango, 1.5 μg total DNA and 17.7 μldeionized water. The mixture has been covered with the 20 μl of mineral oil.The reaction mixture for the MspI-analysis (total volume 25 μl) contained: 0.6μl MspI, 2.0 μl 10хBuffer Tango, 1.5 μg total DNA and 17.1 μl deionized water.The mixture has been covered with the 20 μl of mineral oil. The reactionmixture for the MboI-analysis (total volume 25 μl) contained: 0.2μl MboI, 2.0μl 10хBuffer Tango, 1.5 μg total DNA and 17.7 μl deionized water. The mixturehas been covered with the 20 μl of mineral oil. The conditions for restrictionreactions were: 16 hours under 37˚C, then 20 min under 65˚C (for HpaII andMboI) and 20 min under 80˚C (for MspI) to stop the reactions. Products of PCRand restriction analysis were separated in 1.0% agarose gel with TBE-buffer atthe presence of ethidium bromide, and visualized in UV-transilluminator. The samevolume of PCR and restriction products (10 μl) was brought into the gelpockets. The FastRuler High Range DNA Ladder (“Fermentas”, Germany) withfragments’ length 10,000, 4000, 2000, 1000 and 500 base pairs and the FastRulerLow Range DNA Ladder (“Fermentas”, Germany) with fragment length 1500, 850,400, 200 and 50 base pairs were used as a molecular weight markers. IndependentISSR-PCR was performed 8 times also. Experimental findings statisticalanalysis–the variance value and the Brave-Pirson’s correlation coefficientwerecalculated with traditional method [19]. Table 1. Restriction enzymes and theirsites of recognition/restriction. Restriction enzyme Sites ofrecognition/restriction MspI HpaII MboI 5’C…C*CG, C…5’ 5’…C*CGG…3’ 3’G…G C*C…5’5’…C*CGC…3’ 3’…CT…AG *C…5’ 3. Results and Discussion The obtained cytogeneticdata pointed out major varieties in chromosome aberrations’ yield (Ab, %)appeared among groups F-G, M-G and S-G seedling (Figure 1). Theelectrophoregram of isolated DNA nativity is shown in Figure 2. Theelectrophoregram of native DNA amplification with ISSR primers (Figure 3) showsspecific differences Figure 1. The chromosome aberration yield (α = 0.05) inroot meristem of corn seedlings with various germination rates;C-non–irradiated seedlings; UV-C-seedlings irradiated with UV-C. M 1 2 3 4 5 6Figure 2. The electrophoregram of isolated DNA quality. М—high-molecular-weightmarker; 1—“FG” sample; 2— “FG + UV-C” sample; 3—“MG” sample; 4—“MG + UV-C”sample; 5—“SG” sample; 6—“SG + UV-C” sample. M 1 2 3 4 5 6 Figure 3. Theelectrophoregram of native DNA amplification products with ISSR primers.М—high-molecular-weight marker; 1—“FG” sample; 2—“FG+UV-C” sample; 3— “M-G”sample; 4—“M-G + UV-C” sample; 5—“SG” sample; 6—“S-G + UV-C” sample. Copyright© 2013 SciRes. CellBio 166 D. A. SOKOLOVA ET AL. in amplicons range ofirradiated and unirradiated fastgrowing seedlings (positions 1 and 2). Thesedata do not contradict with data about good nativity of isolated DNA. The mostappropriate explanation is connected with appearance of damage during PCR thatmight indirectly evidence about low methylation level of this DNA part infast-growing seedlings resulting to greater vulnerability of these DNA samplers1. An electrophoregram of the amplification products obtained by ISSR-PCR ofthe MspI restriction products (Figure 4) illustrated the differences in DNAmethylation pattern among seedlings with various germination rates (positions1, 3, 5). The electrophoregram of fast-germinated seedlings (FG, position 1)had four distinct groups of amplicons with almost the same number of DNAfragments. The groups of amplicons (positions 3 and 5) for variants “M-G” and“S-G” had the same molecular weight, but different number of DNA fragments. Thecomparison of positions 1 and 2, 3 and 4, 5 and 6 of this electrophoregram(Figure 4) shows great changes of satellite DNA methylation pattern afterirradiation. Positions 2, 4, 6 are also differing from each others thatcorrespond to increased chromosome aberration’ yield after UV-C exposure(Figure 1). Also considerable differences between methylation patterns ofsatellite DNA of seedlings that initially had various germination rates(positions 1, 3, 5) were observed in separating amplification products of MboIrestricts with ISSR–primers (Figure 5). There was just one type of ampliconsfor “F-G” seedlings and great differences between “M-G” and “S-G” variants.Electrophoregram for “M-G” seedlings had four distinct groups of amplicons withcomparatively more high-molecular fragments. The comparison of positions 1 and2, 3 and 4, 5 and 6 of this electrophoregram (Figure 5) shows great changes ofsatellite DNA methylation pattern after irradiation. M 1 2 3 4 5 6 Figure 4.The electrophoregram of the amplification products obtained by ISSR-PCR of theMspI restriction products. М—high-molecular-weight marker; 1—“FG” sample; 2—“FG+ UV-C” sample; 3—“MG” sample; 4—“MG + UV-C” sample; 5—“SG” sample; 6—“SG +UV-C” sample. M 1 2 3 4 5 6 Figure 5. The electrophoregram of the amplificationproducts obtained by ISSR-PCR of the MboI restriction products.М—high-molecular-weight marker; 1—“FG” sample; 2—“FG + UV-C” sample; 3—“MG”sample; 4—“MG + UV-C” sample; 5—“SG” sample; 6—“SG + UV-C” sample. Positions 2,4 do not have major differences from each other. The greatest difference isobserved between positions 4 and 6. Such differences correspond to variousincreasings in the chromosome aberration’ yield after UVC exposure (Figure 1).Thus original difference in satellite DNA methylation pattern is connected todifferences in pattern changes under irradiation exposure and chromosomeaberration’ yield. This indicates both different effectiveness of repairprocesses or various original sensitiveness to damage. Consider the data aboutacute UV-C exposure mode “adaptive-challenging irradiation” as well as combinedexposure whereby seedlings growing from preliminary gamma-irradiated seeds havebeen exposed. Chromosome aberration yield in root meristematic tissue (Figure6) indicates to major differences in appearance of seedlings’ adaptivereactions that have grown from unexposed and gamma-exposed seeds. Chronicradiation exposure of seeds causes increase of chromosome aberration rate inseedlings’ root meristematic tissues. UV-C exposure of seedlings frompreliminary unirradiated seeds with adaptive dose leads to increasingchromosome aberration yield whereas exposure of seedlings from preliminaryirradiated seeds causes the hormetic effect. Exposure mode “adaptive, in 4hours-challenging” causes the appearance of adaptive response for seedlingswithout preliminary irradiation exposure; with interval in 24 hours betweenadaptive and challenging exposure the adaptive response haven’t been observed.Seedlings from preliminary irradiated seeds didn’t show the adaptive responsewith both intervals between adaptive and challenging irradiation. Anexplanation of such phenomena from the standpoint about meristematic tissue’heterogeneity and possibility of two forms of repopulation renewal is given inpaper [14]. The object of this study is to compare stability changes to stressfactor affecting and changes in satCopyright © 2013 SciRes. CellBio D. A.SOKOLOVA ET AL. 167 Figure 6. The chromosome aberration yield (α = 0.05) inroot meristem of corn seedlings from non preliminary gamma-irradiated seeds(NPI), and preliminary gammairradiated seeds, ( PI ) with UV-C irradiation modeas described in “ Material and Methods”. ellite DNA methylation pattern. Theelectrophoregrams of DNA quality checking are shown in Figure 7. These resultsdemonstrate the absence of meaningful DNA fragmentation that would take a placein apoptosis inducing by UV-C irradiation. The electrophoregram of native DNAamplification shows specific differences in comparison with all other variantsof amplicon’s range for variant “adaptive-challenge exposure in 24 hours”(Position 6). The most appropriate explanation is connected to appearance ofulterior (single-stranded) injuries during PCR. It’s essential that thefeatures of DNA fragmentation are observed in a variant exposed with full doseat a time. For Figures 7-11: 1. Total control (NPI and non UV-C irradiatedseedlings); 2. NPI + adaptive exposure; 3. NPI + adaptive exposure, in 4hours-challenging one; 4. NPI + whole dose exposure (7.2 kJ/m2 ); exposuresimultaneously with the challenging irradiation of variant 3); 5. NPI +adaptive exposure, in 24 hours-challenging one; 6. NPI+ whole dose exposure;irradiation simultaneously with the challenging irradiation of variant 5; 7. PI+ non UV-C irradiation; 8. PI + adaptive exposure; 9. PI + adaptive exposure,in 4 hours–challenging one;10.PI + whole dose exposure; exposure simultaneouslywith the challenging irradiation of variant 3 and 9); 11. PI + adaptiveexposure, in 24 hours-challenging one; 12. PI + whole dose exposure;irradiation simultaneously with the challenging irradiation of variants 5 and11. The electrophoregram of MboI restricts’ ISSR amplification shows variousdifferences in DNA methylation patterns according to exposure mode. Comparisonof positions 1 (seedlings from seeds without preliminary irradiation) and 7(seedlings from preliminary gammairradiated seeds) indicates to majordifferences in range of amplicons: as a result of dry seeds chronic exposurethe satellite DNA methylation pattern of seedlings shows some complication onelectrophoregram because of apM 1 2 3 4 5 6 7 8 9 10 11 12 Figure 7. Theelectrophoregram of isolated DNA quality. M 1 2 3 4 5 6 7 8 9 10 11 12 Figure8. The electrophoregram of native DNA ISSR-amplification. M 1 2 3 4 5 6 7 8 910 11 12 Figure 9. The electrophoregram of MboI restricts’ ISSR amplification.M 1 2 3 4 5 6 7 8 9 10 11 12 Figure 10. The electrophoregram ofISSR-amplification of MspI restricts. Copyright © 2013 SciRes. CellBio 168 D.A. SOKOLOVA ET AL. M 1 2 3 4 5 6 7 8 9 10 11 12 Figure 11. The electrophoregramof HpaII-restricts ISSRamplification. pearance of amplicons with low and middleweight. It’s essential that variants 9 - 12 show identical ranges and parallelswith the same chromosome aberration yield in the variants are also possible(Figure 6). The electrophoregram of ISSR-amplification of MspI restricts showsvarious changes in DNA methylation pattern according to exposure mode.Comparison of positions 1 (seedlings from seeds without preliminaryirradiation) and 7 (seedlings from preliminary gamma-exposed seeds) indicatesto major differences in amplicons range: after dry seeds’ chronic irradiationsatellite DNA methylation pattern leads to great complication ofelectrophoregram because of appearing low-weight amplicons indicated toincrease of restriction MspI sites. Major difference of 8th variant isobserved, which demonstrates hormesis effect in terms of chromosome aberrationyield. It’s essential that variants 9 - 12 show identical ranges as well asMboI enzyme. Electrophoregram of HpaII-restricts’ ISSR-amplification indicatesto less dependence of amplicon range from exposure mode. The differencesbetween positions 1 (seedlings from seeds without preliminary irradiation) and7 (seedlings from preliminary gamma-irradiated seeds) are also visible becauseof less content of highmolecular weight fragments. Great difference of variants9 and 10-12 that corresponds almost identical chromosome aberration yield isobserved (Figure 6). Quantify connection between changes in satellite DNAmethylation patterns and chromosome aberrations’ yield under various affectsusing Brave-Pirson’s linear correlation. To perform such approach we have tosuggest some principals of quantifying various changes on electrophoregrams andtheir degrees. There are several significant quantitative characteristics ofDNA methylation pattern changes that could be registered on electrophoregrams:1) Change of general amplicons’ number; wherein following versions are possible:a) Changes in molecular mass of amplicons, i.e. position related to ladderbands on electrophoregram but within the amplicons’ mass of control variant;nevertheless the number of new control bands or their disappearance could bevarious; b) The appearance of amplicons with mass that greatly exceed thelimits of control bands’ mass both in the range of more high molecular massand; 2) Change of bands’ brightness–that indicates to changing number ofamplicone’ fragments of the same mass; 3) The combination of the listed abovequantitative indicators. Interactions between these various indicators greatlyexceed the classification possibilities of changes in DNA methylation patternand accordingly the correlation estimation between their changing rates. Considerthe simplest connection type-linear correlation between the number of ampliconsand the chromosome aberrations’ yield for various series of experiments. Thestatistical analysis for each experimental series was conducted separately.Correlation indexes shown in Table 2 indicate to existence of significant (α =0.05) positive correlation between amplicons’ number and chromosome aberrationyield for experiments with acute UV-C exposure and MboI enzyme and significantnegative correlation (α= 0.01) just for experiments with composed radiationexposure and MspI ans MboI enzymes. To continue the correlation analysis usingmore detail approach via determination of 5 grades (from 0 to 4) of methylationpatterns’ varieties. It will be used following indexes: 0—The absence ofdifferences according to control variant; 1—The differences in amplicons’number, which mass is in the range of control amplicons’ mass; 2—Thedifferences in amplicons’ number, which mass is in the range of controlamplicons’ mass + differences in brightness of bands that indicates to variousnumber of fragments in one amplicon; 3—The differences in amplicons’ number,which mass is not in the range of control amplicons’ mass; 4—The differences inamplicons’ number, which mass is not in the range of control amplicons’ mass +differTable 2. The coefficient of correlation between amplicons’ number andchromosome aberration yield. Correlation Coefficient, R Experimental seriesMspI HpaII MboI 1. 0.29 - 0.72 2 0.69 0.105 0.82* 3 −0.89** −0.73 −0.89**Significance of a correlation coefficient, * α = 0.05, **α = 0.01. Copyright ©2013 SciRes. CellBio D. A. SOKOLOVA ET AL. 169 ences in brightness of bands.Results of this way of correlation assessment are shown in Table 3. Thus suchapproach for determination the degree of methylation pattern changes increasedthe correlation index for some variants and decreased it for another one.Continue the specification of approach to correlation assessment viadetermination of 9 grades (from 0 to 8) of methylation patterns’ varieties. Itwill be used following indexes: 0—The absence of differences according tocontrol variant; 1—The differences in amplicons’ number (n), which mass is inthe range of control amplicons’ mass, n ≤ 3; 2—The differences in amplicons’number (n), which mass is in the range of control amplicons’ mass, n ≤ 3 +differences in their brightness; 3—The differences in amplicons’ number (n >3), which mass is in the range of control amplicons’ mass; 4—The differences inamplicons’ number (n > 3), which mass is in the range of control amplicons’mass + differences in their brightness; 5—The differences in amplicons’ number(n ≤ 3), which mass is not in the range of control amplicons’ mass; 6—Thedifferences in amplicons’ number (n ≤ 3), which mass is not in the range ofcontrol amplicons’ mass + differences in their brightness; 7—The differences inamplicons’ number (n > 3), which mass is not in the range of controlamplicons’ mass; 8—The differences in amplicons’ number (n > 3), which massis not in the range of control amplicons’ mass + differences in theirbrightness. Results of this way of correlation assessment are shown in Table 4.Specification of differences between electrophoregrams and number of theirgrades could be continued using additional characteristics of electrophoregramsand their combination. However performed correlation analysis using threeapproaches allows to make general Table 3. The coefficient of correlationbetween 5 grades of electrophoregram varieties and chromosome aberration yield.Correlation Coefficient, R Experimental series MspI HpaII MboI 1 0.27 - 0.57 20.81* 0.77 0.91** 3 0.43 0.43 0.64 * α = 0.05; **α = 0.01. Table 4. Thecoefficient of correlation between 9 grades of electrophoregram varieties andchromosome aberration yield. Correlation Coefficient, R Experimental seriesMspI HpaII MboI 1 0.57 - 0.64 2 0.87* 0.84* 0.89** 3 0.21 0.71 0.7 * α = 0.05;**α = 0.01. conclusion about existence of quantitative connection betweenchromosome aberration yield like both integral cell stress response and changesin satellite DNA methylation pattern. Performed analysis also show that uniqueapproach to quantify connection between chromosome aberration yield and theirrates on electrophoregrams doesn’t exist. Such suggestion points to possibledifference in mechanisms of cell response to exposure type (physical exposure,exposure rate and duration and so on). The investigation of differential geneactivity using micro array methods and changes of DNA methylation pattern indicatedthat according to exposure type and intensity the activity of various genegroups had changed. That’s for satellite DNA–its direct or indirectparticipation in cell stress response could be related to different mechanismsaccording to exposure type. Despite of ways of satellite DNA participation instress reaction such mechanisms are different as well as for transcribed DNA.It should have been emphasized that for experimental series 1 with 3polymorphic groups of plants significant correlations weren’t obtained with anycriteria. Reason for such phenomena is connected to original epigeneticalpolymorphism of biological material and deficient sampling from 6 variants forcorrelation assay. 4. Conclusions Comparison of the results of cytogeneticanalysis with changes in methylation patterns of satellite DNA afterirradiation pointed out to their connections with different stress tolerance.Change of the satellite DNA methylation profile may reflect the mobile elementsactivization, mostly associated with satellite DNA [13], and indicate thedamage’s progress. Such ability is especially essential for corn; it’s knownthat nearly 50% satellite DNA of the plant are represented with mobile elements[2,3,15]. At the same time, it can result in DNA configuration changes and hasthe protective effect. Since functional importance of satellite DNA wasexplained in part by Copyright © 2013 SciRes. CellBio 170 D. A. SOKOLOVA ET AL.conceptions, it was assumed to have a structural role in spatial organizationof genome, and take part in homologous chromosomes’ conjugation during meiosisand replication of chromosomes’ telomeric sites [15]. Probably in this casedifferent methylation patterns of satellite DNA, which meant various chromatinconformations, could have interactive character: specific methylation patternsof transcribed DNA may play role in transcription processes only under definiteconformation of all the chromatin. Interaction between satellite DNAmethylation pattern and resistance to external exposures might have anotherexplanation. It could result not only from efficient functioning of repairsystems of spontaneous и inducible DNA injuries, but also from systemsresponsible for passing cell cycle checkpoints and complete repair ofdouble-stranded DNA breaks. It was known, that effective repair ofdouble-stranded DNA breaks with the mechanism of homologous recombination waspossible only under conditions of certain level of chromatin relaxation [20],so it was also associated directly to the conformation of satellite DNA. Thusconducted research provides grounds to suggest that satellite DNA methylationpatterns and their changes might have various roles in cell response to stressfactor. All the functions are mediated by conformation changes of these DNA sequences.5. Acknowledgements Funding for the study was provided by the Academy ofScience of Ukraine, Grant No. III-3-08 “Epigenetic components of plantadaptation”. We thank PhD, Head of Laboratory of Molecular Genetics MorgunB.V., Institute of Cell Biology and Genetic Engineering, National Academy ofScience of Ukraine for help in method mastering.